Practice
The trace that had to survive two gateways
One W3C trace follows an Azure AI-agent request from browser to model, while prompts stay out of telemetry.
AI-generated, human-reviewed: the first draft was generated by an AI agent; I fact-checked, tested, and edited it. AI use policy
The itchy moment was not a crash. Crashes are almost generous. They leave a body.
This was worse: an AI-agent request that could be slow, wrong, or both, while the evidence lived in different neighborhoods. Browser telemetry had one story. API Management had another. The ASP.NET Core agent had opinions. The model gateway was its own little weather system.
I wanted one answer to a plain support question: where did this request go, and what happened to it on the way? I also wanted the answer without turning Application Insights into a transcript vault, because “we logged the prompt by accident” is not the charming kind of observability.
At a glance
The first hop needed restraint
The API had to keep the lineage alive
Baggage was the tiny security review
The words needed a different lane
The query turned the trace into a map
Why this exists#
AI-agent demos are very good at producing a chat bubble and a celebratory screenshot. They are less charming when a user says the answer was slow, wrong, or both, and the evidence is scattered across a browser, a front gateway, an agent API, another gateway, and a model endpoint. At that point, the phrase “distributed system” stops sounding architectural and starts sounding like an excuse with invoices.
- The itch: An agent request crosses the browser, API Management, ASP.NET Core, Microsoft Agent Framework, an AI gateway, and a model, but the useful facts can land as disconnected telemetry and content records.
- Why I built it: To prove a hypothesis: one standard W3C trace can follow the request end to end, while prompts, replies, comments, and tool arguments stay out of Application Insights and live only in the content lane when capture is enabled.
- What you get: A checked path for preserving trace context, dropping untrusted baggage, returning the trace ID, walking the request in KQL, and separating operational telemetry from evaluation content.
- Who this is for: Engineers, architects, and platform owners putting an AI agent behind web APIs on Azure, especially if they need supportable traces without turning telemetry into a transcript service.
- Who can skip it: If your agent always answers instantly and nobody ever asks why, enjoy the alternate timeline.
The rest of the post turns that hypothesis into the concrete browser, gateway, API, content-lane, and KQL pieces that make the trace boring in the best possible way.
The plan#
The bet was simple: let W3C Trace Context do the correlation work, and make every component agree not to get clever. The browser would start the trace. API Management would pass traceparent and tracestate through unchanged. ASP.NET Core and the Microsoft Agent Framework would continue the same operation. The AI gateway would do its job without becoming a telemetry cul-de-sac. The content lane would carry prompts and replies somewhere safer than the log workspace.
You will want enough comfort with C#, JavaScript, KQL, and API Management policy XML to recognize the moving parts; tracing expertise is optional, and perhaps healthier in moderation.
Here is what I thought the path should look like.
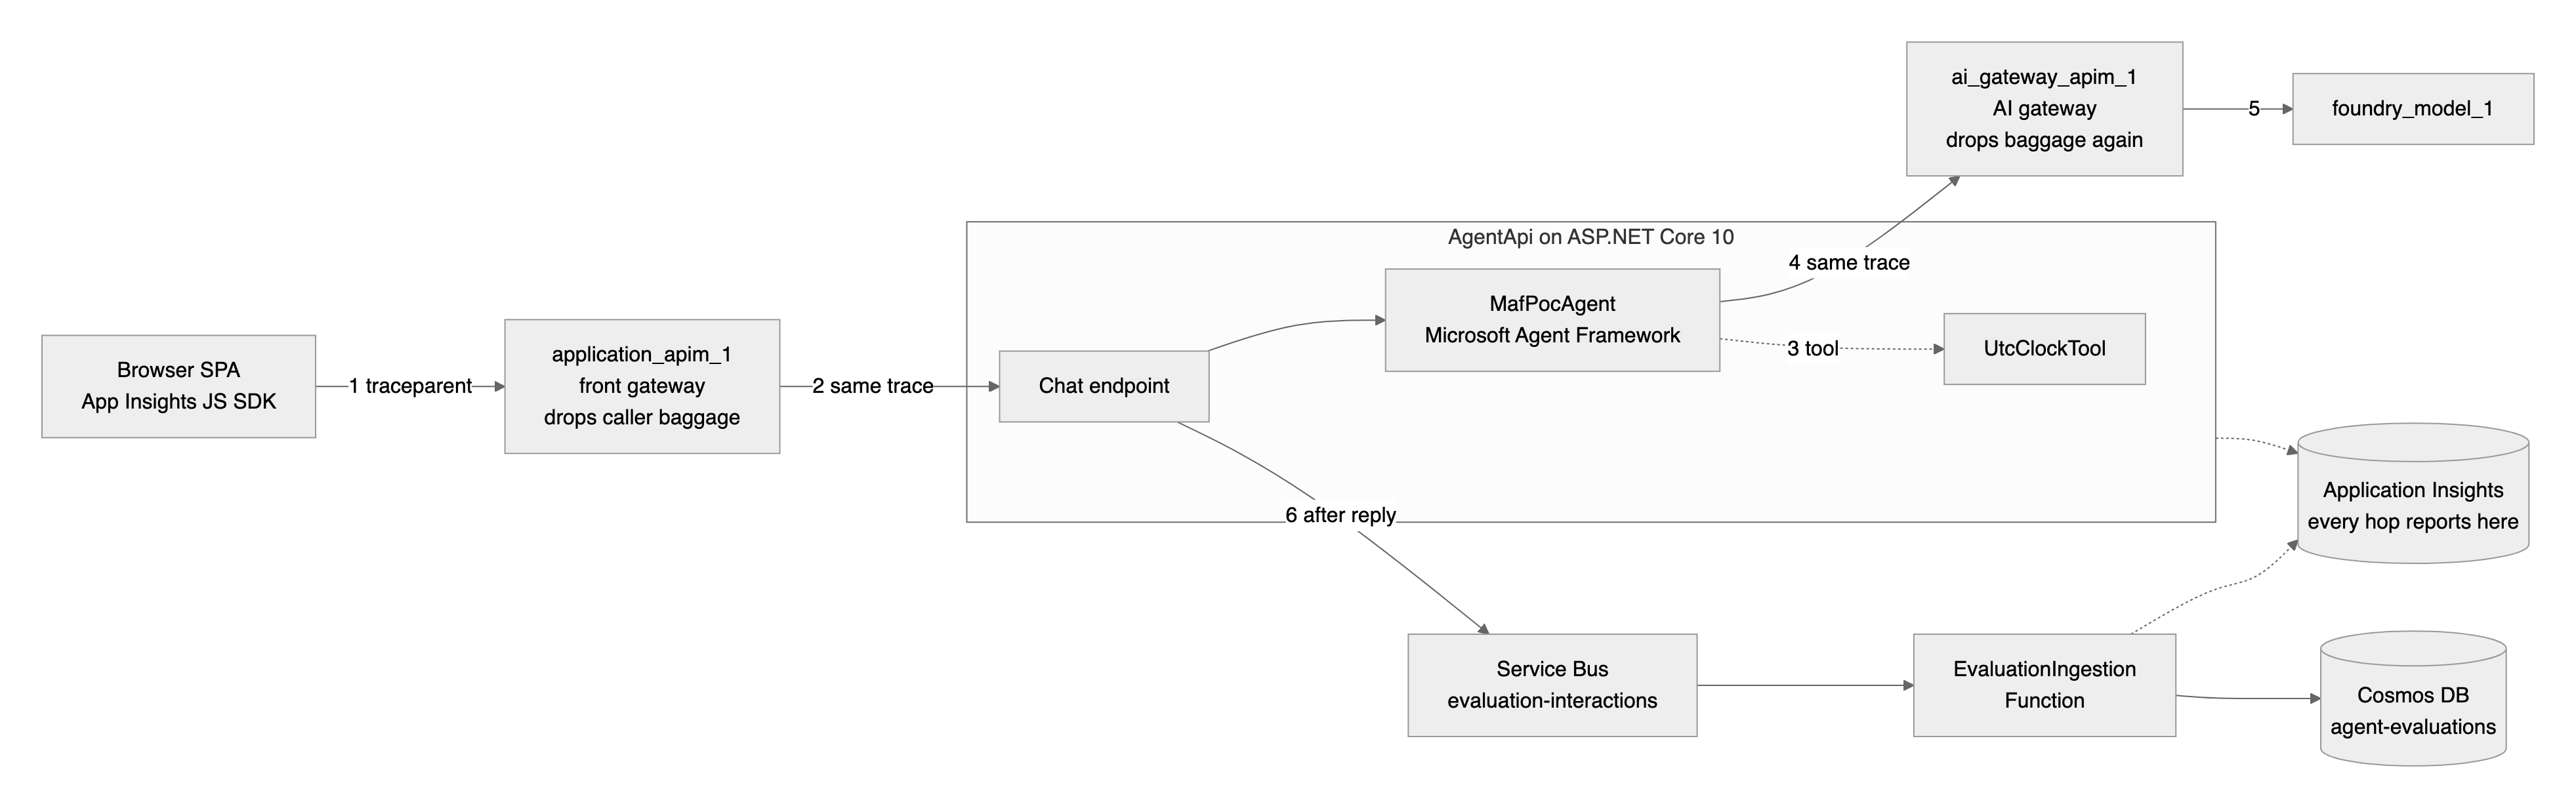
The request starts in the browser SPA, crosses the front API Management gateway, reaches AgentApi, runs MafPocAgent, calls the model through a second API Management gateway, and then sends an evaluation record through Service Bus to Cosmos DB. Application Insights gets IDs, timings, outcomes, and hop markers. Cosmos DB gets the words.
That separation is the story. Everything else is plumbing with a witness.
1. The first hop needed restraint#
The first thing I tried was the thing that should have been enough: enable W3C tracing in the browser and let the Application Insights SDK attach traceparent to calls to the API host.
The first thing I tried was the thing that should have been enough: enable W3C tracing in the browser and let the Application Insights SDK attach traceparent to calls to the API host.
That part worked, but it exposed the first trust boundary. Browsers can send headers, and callers can bring their own baggage. Baggage is useful when you packed it yourself. It is less useful when it arrives from the internet wearing a fake mustache.
So the browser starts the trace, keeps a scrubbed dependency span for the API call, and the front gateway lets the trace through while deleting caller baggage.
export const appInsights = new ApplicationInsights({
  config: {
    connectionString,
    distributedTracingMode: DistributedTracingModes.W3C,
    enableCorsCorrelation: true,
    correlationHeaderDomains: apiHost ? [apiHost] : [],
    enableAutoRouteTracking: false,
    disablePageViewTracking: true,
    disableExceptionTracking: true,
    autoTrackPageVisitTime: false,
    enableUnhandledPromiseRejectionTracking: false,
    enableRequestHeaderTracking: false,
    enableResponseHeaderTracking: false,
    enableAjaxErrorStatusText: false,
    enableAjaxPerfTracking: false,
    disableCookiesUsage: true,
    samplingPercentage: 100,
  },
});

appInsights.loadAppInsights();

appInsights.addTelemetryInitializer((envelope) => {
  if (envelope.baseType !== "RemoteDependencyData") {
    return false;
  }

  const dependency = envelope.baseData;
  const dependencyHost = hostFromUrl(dependency?.data) ?? dependency?.target;
  if (!apiHost || dependencyHost !== apiHost) {
    return false;
  }

  const method = dependency?.name?.match(/^(GET|POST|PUT|PATCH|DELETE|OPTIONS|HEAD)\b/u)?.[1];
  if (!method) {
    return false;
  }

  dependency.name = `${method} /api`;
  dependency.target = apiHost;
  delete dependency.data;
  delete dependency.properties;
  delete dependency.measurements;
  delete envelope.data;
  return true;
});

function hostFromUrl(value) {
  try {
    return value ? new URL(value).host : undefined;
  } catch {
    return undefined;
  }
}
Complete snippet: Browser W3C tracing with Application Insights
The gateway policy is almost more important for what it does not do. It does not synthesize a trace. It does not rename the trace. It does not try to be a distributed-tracing thought leader.
<allowed-headers>
  <header>Content-Type</header>
  <header>traceparent</header>
  <header>tracestate</header>
</allowed-headers>
</cors>
<!--
  W3C baggage from a caller is untrusted. AgentApi would copy it onto spans and relay it to
  the AI gateway, so it is dropped here at the trust boundary. traceparent/tracestate pass
  through untouched.
-->
<set-header name="baggage" exists-action="delete" />
Complete snippet: API Management policy that keeps the trace and drops caller baggage
2. The API had to keep the lineage alive#
Once the trace reached AgentApi, the next question was whether the model call would stay inside it. Presence of a traceparent header was not enough; a brand-new trace with a very official-looking header would still be wrong.
Once the trace reached AgentApi, the next question was whether the model call would stay inside it.
The source tests proved the important part: the outbound model request carries the caller’s trace ID, not a fresh one. The API setup registers ASP.NET Core, HttpClient, the Microsoft Agent Framework source, Service Bus, and the content-lane dispatcher under the same OpenTelemetry pipeline.
// Use W3C trace context extraction. The request middleware below clears caller baggage before
// any outbound call can happen.
Sdk.SetDefaultTextMapPropagator(new TraceContextPropagator());

builder.Services.AddOpenTelemetry()
    .WithTracing(tracing => tracing
        .AddAspNetCoreInstrumentation()
        .AddHttpClientInstrumentation()
        .AddSource(ServiceName)
        .AddProcessor(new ConversationBaggageProcessor()))
    .UseAzureMonitor(options =>
    {
        options.ConnectionString = builder.Configuration["APPLICATIONINSIGHTS_CONNECTION_STRING"];
        // Trace-ID-based sampling keeps whole traces together. 1.0 keeps everything while you
        // commission; lower it later, and use the same ratio in every service.
        options.SamplingRatio = 1.0f;
        // Turn off the default per-process rate limit so SamplingRatio alone decides.
        options.TracesPerSecond = null;
    })
    // Registered after the Azure Monitor distribution so this service name overrides the
    // Container Apps resource detector, which otherwise sets service.name to the app name.
    .ConfigureResource(resource => resource.AddService(serviceName: ServiceName, serviceVersion: "1.0.0"));

var app = builder.Build();

app.Use(async (context, next) =>
{
    if (Activity.Current is { } activity)
    {
        foreach (var item in activity.Baggage.ToArray())
        {
            activity.SetBaggage(item.Key, null);
        }
    }

    await next(context);
});
Complete snippet, runnable as is: OpenTelemetry and Azure Monitor setup for an agent API
The sequence looked like this once the pieces agreed to cooperate.
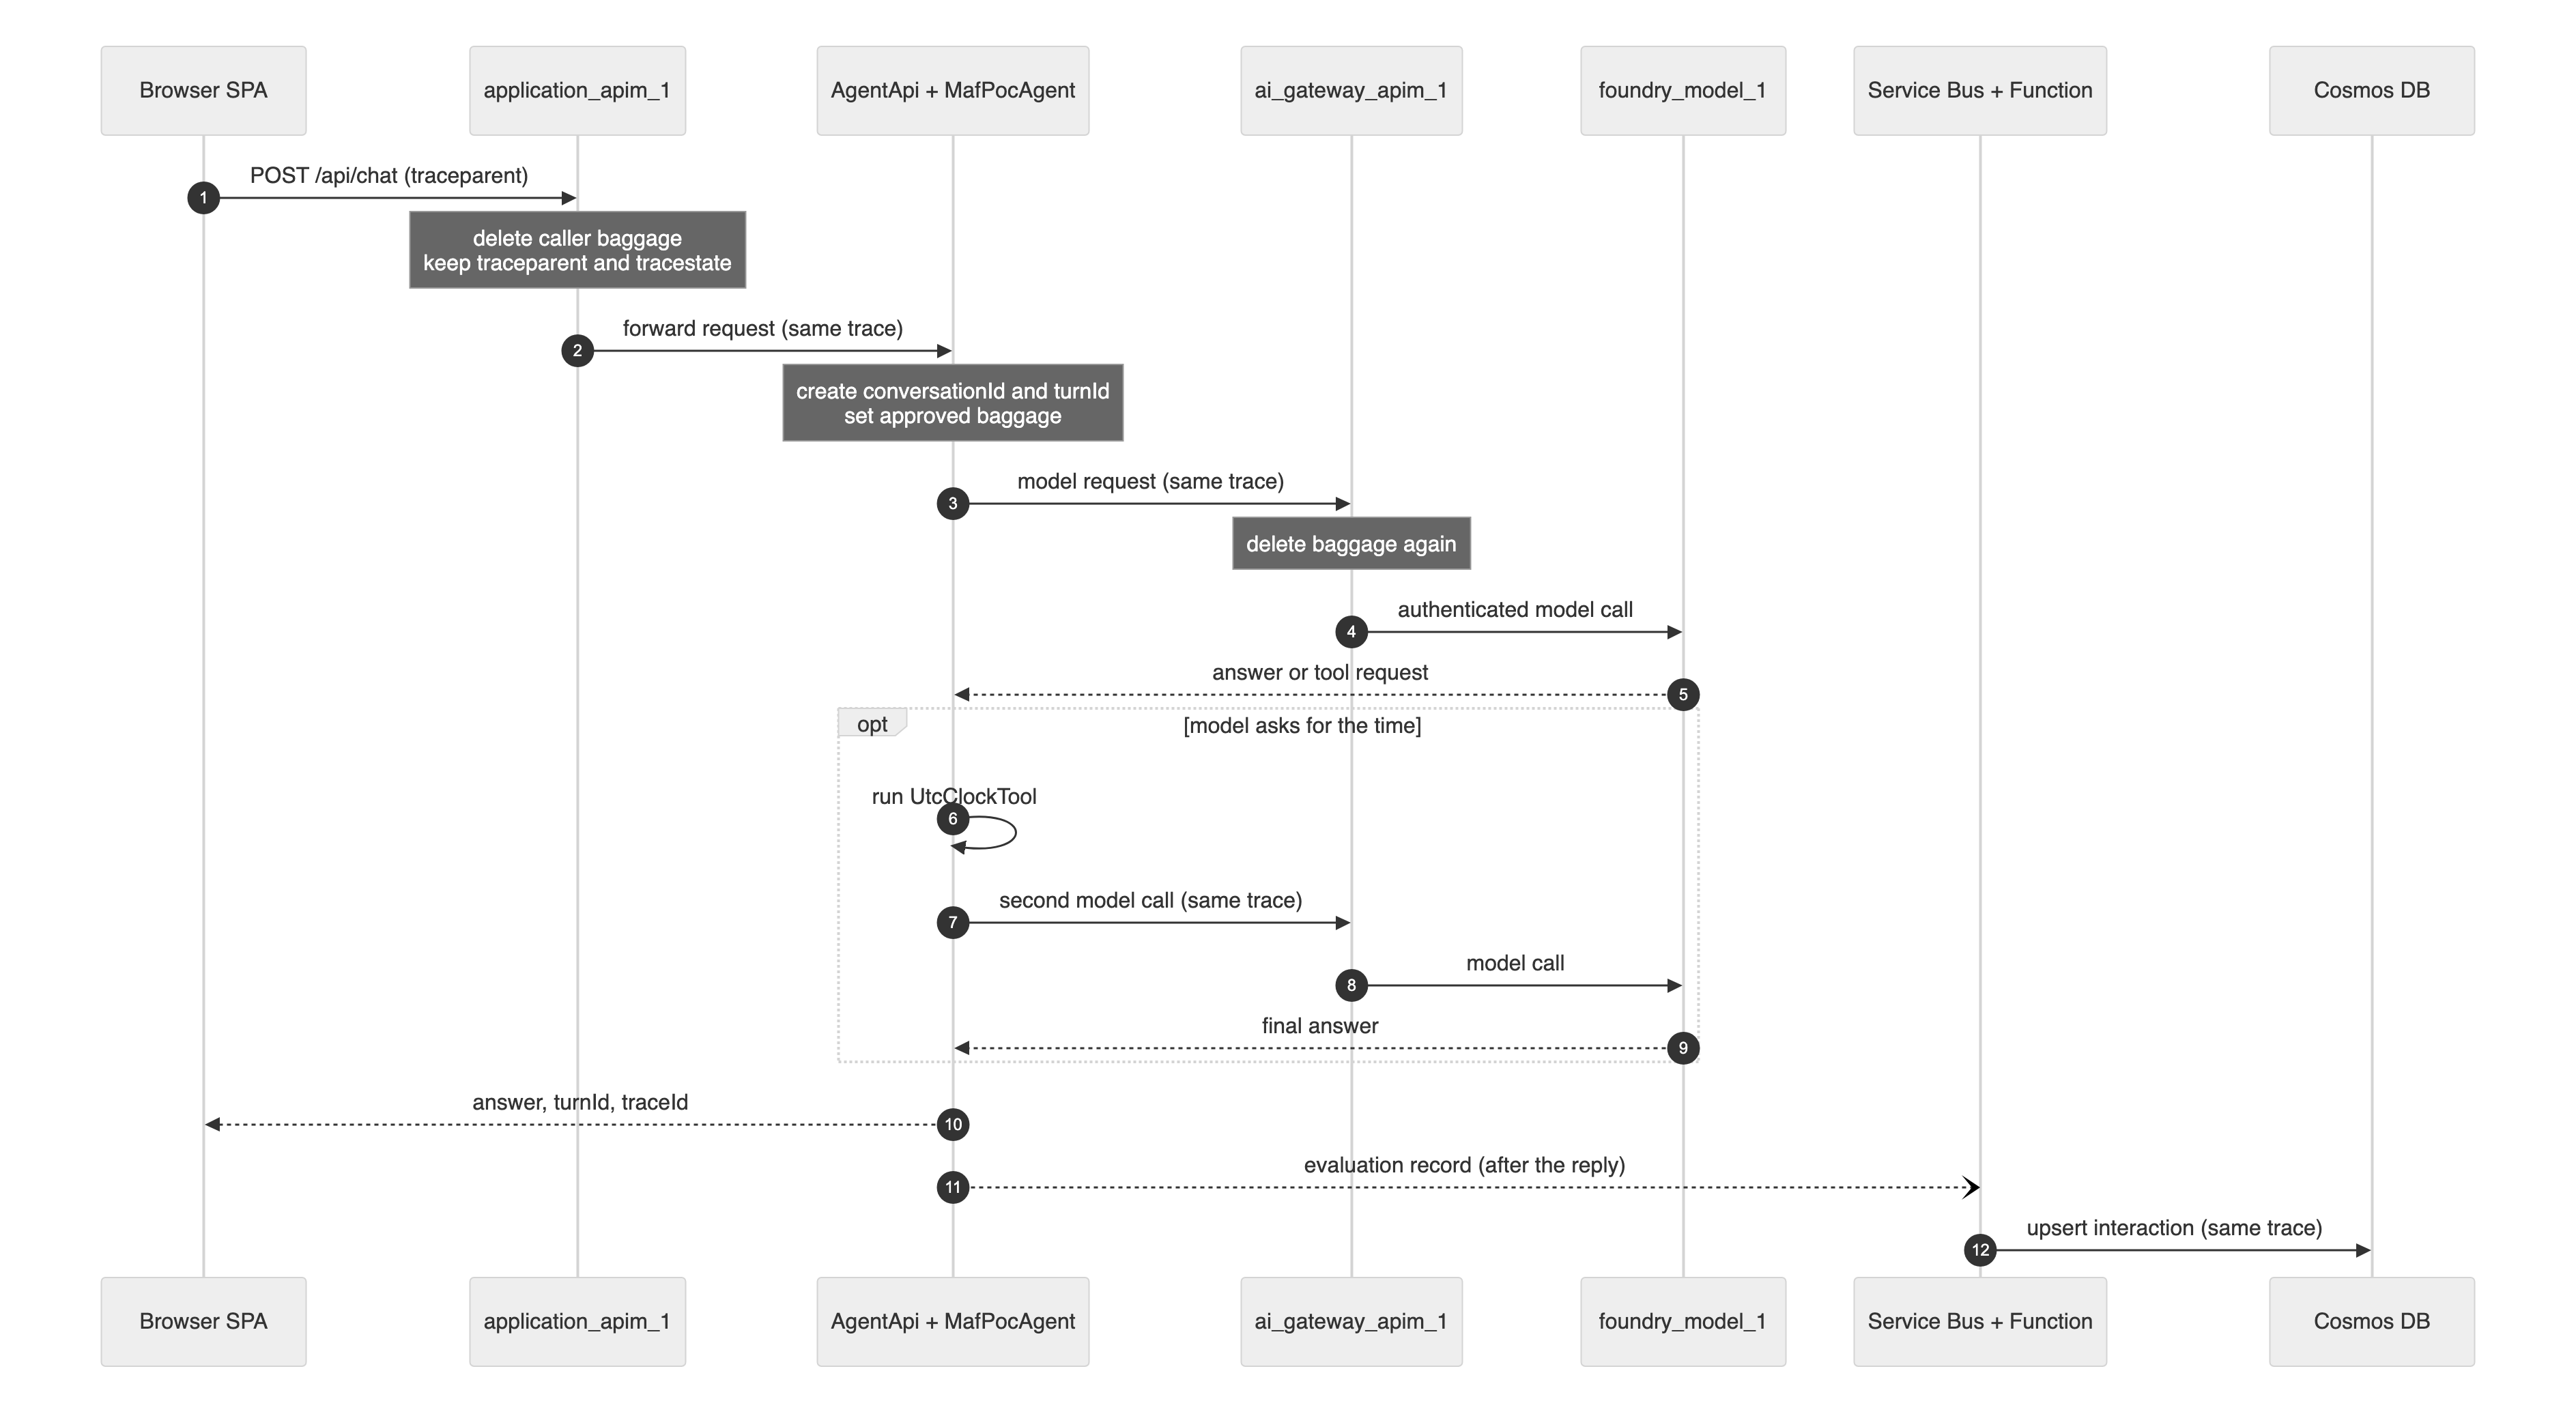
The model may ask the agent to call a tool, in this POC a UTC clock tool, and then the agent calls the model again. Both model calls stay in the same trace. The content lane also stays attached, even though the API replies before storage finishes.
3. Baggage was the tiny security review#
The trace needed continuity, but the baggage needed suspicion. AgentApi clears caller baggage at the request boundary, then generates one approved baggage value, an opaque conversation ID, before it calls the agent. Child spans can use that value as a safe join key. Outbound calls can only carry baggage set by the server after that boundary. The incoming request span cannot use baggage, because any baggage on that span came from the caller.
The trace needed continuity, but the baggage needed suspicion.
That decision became a processor with one job.
public override void OnStart(Activity activity)
{
    // An incoming request span starts before the endpoint sets the baggage, so any value seen
    // here came from the caller's baggage header: untrusted text that must not become span data.
    if (activity.Kind == ActivityKind.Server)
    {
        return;
    }

    var conversationId = activity.GetBaggageItem(BaggageKey);
    if (!string.IsNullOrEmpty(conversationId))
    {
        activity.SetTag(BaggageKey, conversationId);
    }
}
Complete snippet: Copy only trusted baggage onto spans
The test sends caller baggage, including an email-shaped value, and then checks every captured span tag. The caller text never becomes span data. The server-generated conversation ID still reaches the agent spans.
4. The words needed a different lane#
Tracing tells you what happened. Evaluation needs what was said. Those are not the same database, unless you enjoy explaining to people why their prompts are now operational telemetry.
Tracing tells you what happened.
The POC splits each turn into two lanes.
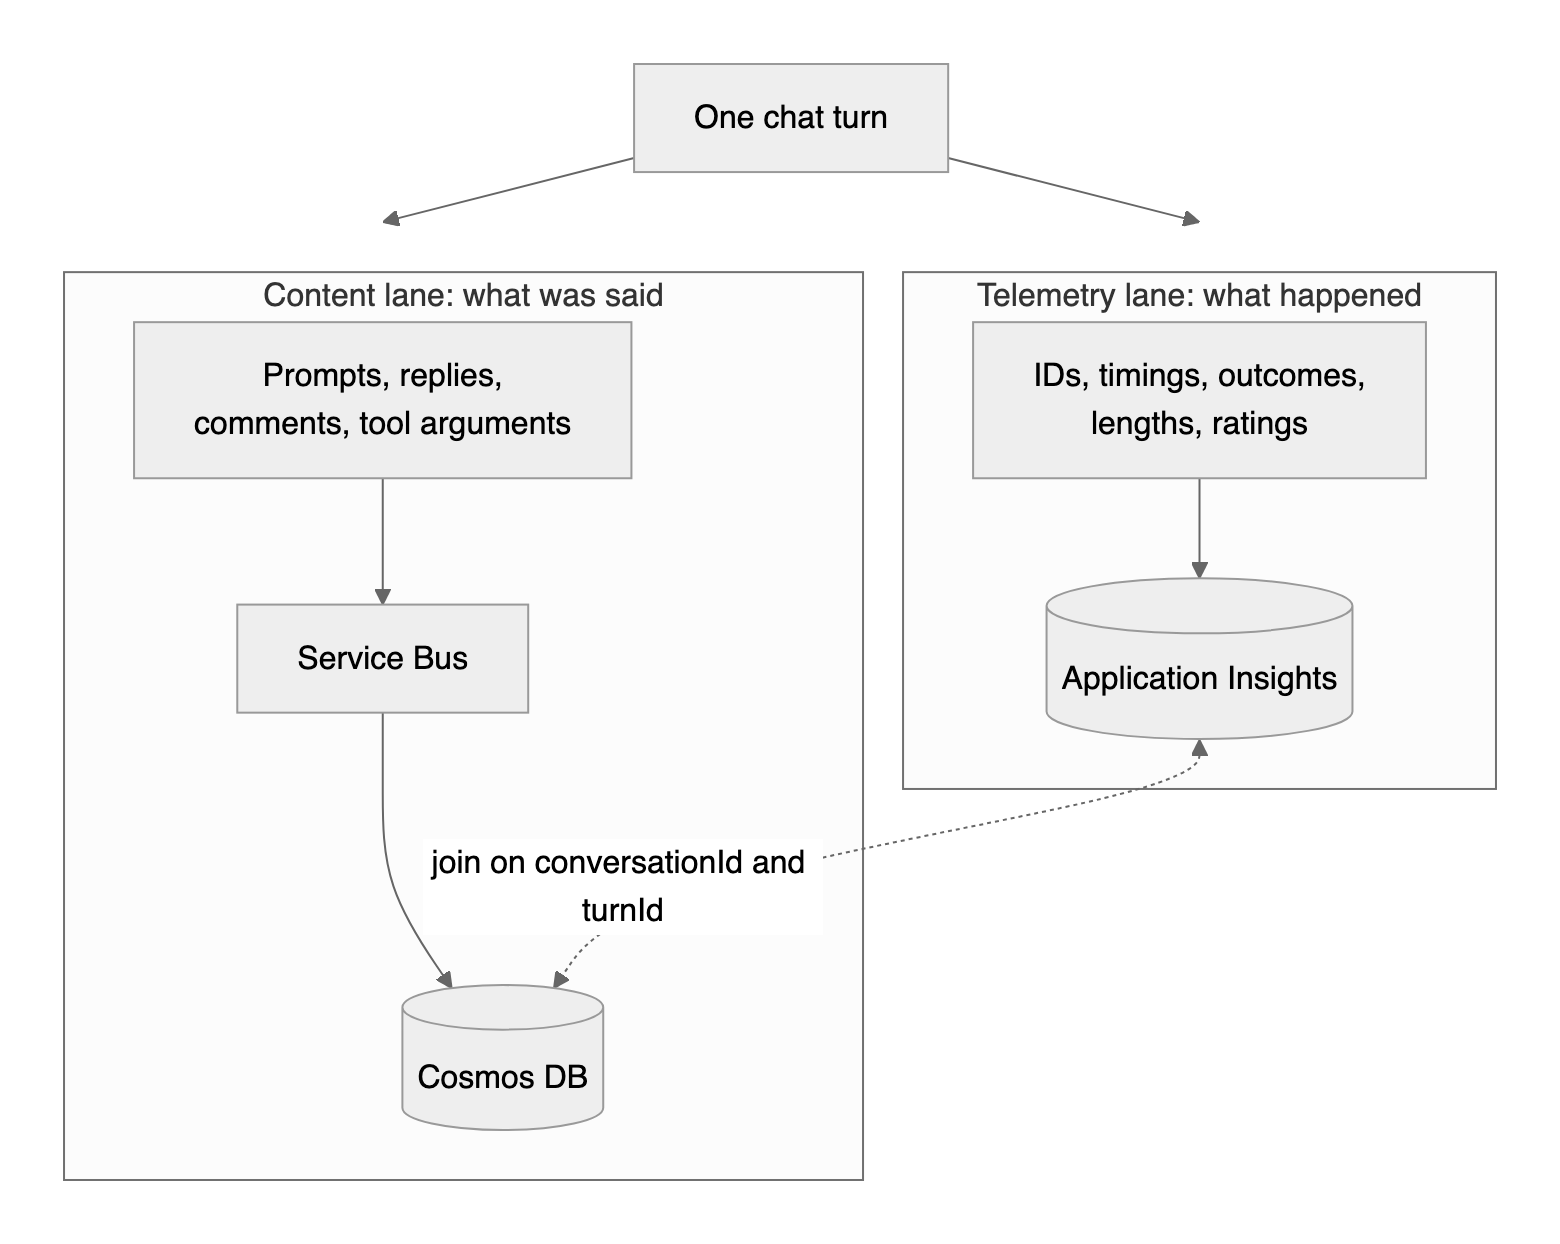
The telemetry lane carries IDs, durations, route names, outcomes, ratings, token counts, tool names, and hop markers. The content lane carries prompts, replies, comments, and tool arguments through Service Bus to Cosmos DB after the reply is sent. The two join on turnId; traceId is useful for operations, but one browser page load can contain several turns.
In code, the endpoint returns first and queues the content record only when capture is enabled. The production code stores more metadata than the description here, but the split is the point: Application Insights gets the marker and IDs; Cosmos DB gets the content. A privacy test searches spans and events for a unique prompt marker and expects not to find it.
5. The query turned the trace into a map#
The trace was present, but a trace without a readable path is just a pile of technically related rows. Every hop writes a short marker, such as [APIM-TO-API], [AGENT-TO-AIGATEWAY], or [FUNCTION-TO-COSMOS]. Then one query replays the request with millisecond offsets.
The trace was present, but a trace without a readable path is just a pile of technically related rows.
let traceId = "PASTE_TRACE_ID";
let allowedMarkers = dynamic([
    "[SPA-TO-APIM]",
    "[APIM-TO-API]",
    "[AGENT-TO-AIGATEWAY]",
    "[API-TO-SERVICEBUS]",
    "[SERVICEBUS-TO-FUNCTION]",
    "[FUNCTION-TO-COSMOS]",
    "[API-TO-APIM]",
    "[APIM-TO-SPA]"
]);
let markers = union isfuzzy=true
    (AppTraces
     | project TimeGenerated, OperationId, rowType = "trace", AppRoleName,
         markerText = Message),
    (AppDependencies
     | project TimeGenerated, OperationId, rowType = "dependency", AppRoleName,
         markerText = Name)
| where OperationId == traceId
| extend marker = extract(@"^\[([A-Z0-9-]+)\]", 0, tostring(markerText))
| where isnotempty(marker) and marker in (allowedMarkers);
let startTime = toscalar(markers | summarize min(TimeGenerated));
markers
| extend offsetMs = datetime_diff("millisecond", TimeGenerated, startTime)
| project offsetMs, TimeGenerated, rowType, AppRoleName, marker
| order by TimeGenerated asc
Complete snippet: Walk one trace hop by hop in KQL
The API returns the trace ID with every answer, so the operational loop becomes delightfully unromantic: copy the ID, paste the query, find the slow hop.
The moment it worked#
Here is the less glamorous victory lap: a real chat UI, a sample answer, and a trace ID I can copy without spelunking through three dashboards first. The UI is running locally against a stub API, which is not production support, but it proves the user-facing contract.
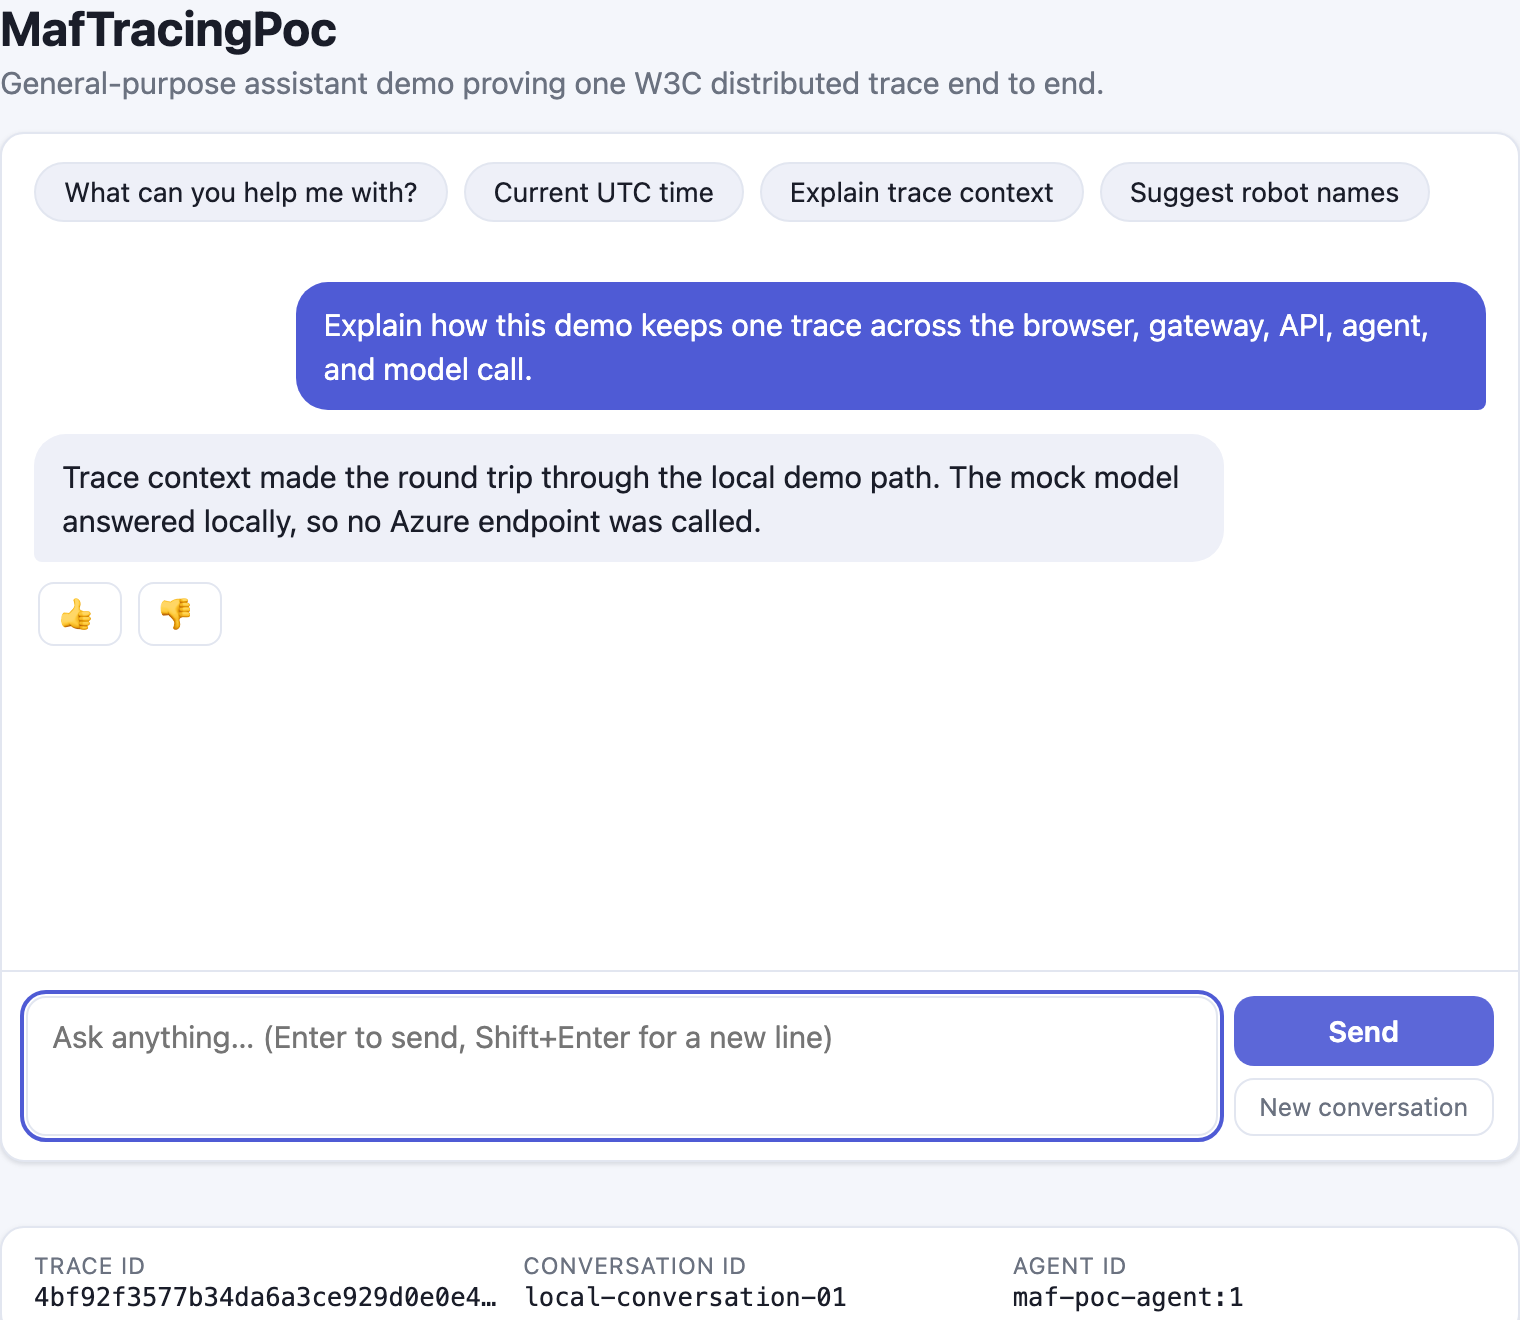
The satisfying part was not only the screenshot. It was the absence of drama.
The smoke test sent chat, posted feedback, tried the direct AgentApi path, waited for telemetry, checked Cosmos DB, inspected Service Bus, and ran a privacy query. The direct call was rejected. The expected hop markers showed up in Application Insights. There were no failed or orphaned spans. Cosmos DB held the interaction and feedback records. The dead-letter queue was empty. The privacy query did not find the unique prompt or comment text anywhere in the workspace.
The unit tests covered the smaller promises that are easy to wave away and later regret:
- The outbound model request carries the caller’s trace ID instead of starting over.
- Caller baggage does not become span data.
- The content-lane delivery span continues the request trace.
- Full or blocked queues do not stall the chat response.
- Prompt, answer, and feedback comment text stay out of span names, tags, baggage, and events.
That is the proof I wanted: one trace for operations, one content lane for evaluation, and no accidental transcript service wearing an observability badge.
What I would tell you before you try this#
- Use W3C Trace Context. Inventing your own trace format is how you get a second hobby.
- Pass
traceparentandtracestatethrough gateways unchanged. The boring path is the correct path. - Delete caller
baggageat the edge. Treat it like untrusted input because it is untrusted input. - Set only your own safe baggage values. Opaque IDs are useful; free text is not.
- Return the trace ID with answers and errors. Support cannot query what it cannot find.
- Join evaluation content on
turnId. A single browser trace can contain more than one chat turn. - Keep prompts, replies, comments, and tool arguments out of telemetry. Put them in a governed content store if you need them.
- Instrument producers and consumers. Message queues are part of the trip, not scenery.
- Test privacy leaks, not only happy-path traces. A passing request can still leak the wrong thing.
- Delete lab resources when you finish. Future you and your budget will both pretend not to know you otherwise.
Put it together#
I am not publishing the whole proof of concept, and you do not need it. The snippets above are complete; together with the Azure resources below, they are the whole idea.
What you need in Azure#
These are the minimum SKUs for the architecture in the plan, with pay-as-you-go prices from the Azure Retail Prices API on Oct 6, 2026 (East US 2; App Service in West US 2).
| Resource | Minimum SKU | Estimated per month |
|---|---|---|
| API Management, front gateway | Developer, 1 unit | $48.03 |
| API Management, AI gateway | Developer, 1 unit | $48.03 |
| App Service plan for the agent API | B1 Linux | $12.41 |
| Foundry model deployment | gpt-5-mini, Global Standard | about $1.00 for 1,000 chat turns |
| Service Bus, Function App, Cosmos DB, Storage | Basic, Flex Consumption, serverless, Standard LRS | under $0.15 at demo scale |
| Application Insights and Log Analytics | Pay-as-you-go | $0.00 within the first 5 GB a month |
| Total | about $109.58 |
About $108.47 of that is fixed: it accrues every hour the resources exist, used or not. The two Developer gateways are most of the bill, and the Developer tier has no SLA, so treat this as a lab, not production.
Build your own version#
- Add the browser tracing module to your web app.
- Put the gateway policy on your front gateway and turn on its Application Insights diagnostics with W3C correlation.
- Start your API from the OpenTelemetry and Azure Monitor setup and add the trusted baggage processor.
- Send a message, copy the trace ID from the reply, and run the hop-by-hop query.
- If you build the content lane, send the records after the reply and join them back with
turnId.
The trace did not make the agent smarter. It made the system explain itself. That is a smaller miracle, but it is the kind you can paste into a query window.
Remember these
From this post
Snippet
Browser W3C tracing with Application Insights
A complete browser module that starts a W3C trace and attaches traceparent only to your own API.
Snippet
API Management policy that keeps the trace and drops caller baggage
A complete front-gateway policy: CORS for W3C headers, untrusted baggage removed, per-caller rate limits, and privacy-safe hop markers.
Architecture
End-to-end tracing for an AI agent behind two API gateways
A reference architecture that keeps one W3C trace from the browser to the model, enforces baggage trust boundaries, and keeps prompts out of telemetry.
Snippet
OpenTelemetry and Azure Monitor setup for an agent API
A complete, runnable ASP.NET Core 10 program: W3C tracing, the agent's spans, trusted baggage, whole-trace sampling, and the trace ID returned to the caller.
Snippet
Copy only trusted baggage onto spans
A complete OpenTelemetry processor that tags child spans with your own conversation ID and ignores whatever the caller sent.
Snippet
Walk one trace hop by hop in KQL
A complete query that replays one request across services with millisecond offsets, using privacy-safe hop markers.